#分享 升息不是崩潰的原因,你被騙了二十年

每次股災之後,市場都會找到一個「兇手」——升息、戰爭、病毒、關稅。媒體需要一個故事,散戶需要一個解釋,於是那個事件就成了崩潰的原因 但這個邏輯是倒過來的 真實的順序是:經濟早就開始惡化,市場能量早就耗竭殆盡,只是還沒有一個事件把它引爆。當系統已經脆弱到臨界點,任何一根稻草都能壓垮它——所以那根稻草看起來像原因,其實只是時機 換句話說,如果不是升息,就是別的。如果不是戰爭,就是數據。如果不是關稅,就是某間銀行倒閉。一個已經耗竭的市場,不缺理由崩潰,它只是在等一個藉口 這也是為什麼每次崩潰事後看都「顯而易見」,但事前沒人相信。因為大家都在等那個藉口出現,而不是在觀察市場本身的狀態 外部事件從來不是崩潰的原因,它只是扣下板機。真正決定子彈會不會打出去的,是槍膛裡有沒有火藥 D-EE 指標試圖偵測的,正是那些火藥 🔬 核心假說 牛市頂部的形成,是一個可觀測的內生耗竭過程,而非隨機事件 這個假說有三層: 第一層 — 耗竭是內生的 🔩 頂部不需要外部觸發。資金在高位越堆越多,推進效率卻越來越低,這個過程是市場參與者集體行為自發演化的結果。火藥是市場自己裝進去的 第二層 — 耗竭是可觀測的 📡 它直接體現在量價結構上:花了多少力氣(成交量 × 波動幅度),換來多少結果(實際價格推進)。比值持續升高,代表買方正在被耗盡。與此同時,價格分布從集中走向均勻,方向性悄悄消散——這是趨勢能量瓦解的物理學語言 第三層 — 耗竭是有節奏的 🎯 它不是一次性事件,而是以週期性峰值重複出現。更關鍵的是:峰值之間的間距,會隨頂部臨近而系統性收斂。間距越來越短,代表市場越來越頻繁地觸及耗竭臨界,直到結構崩塌 這就是為什麼 D-EE指標 不看新聞、不預測事件,卻能在歷次崩潰前持續預警 它偵測的不是「發生了什麼」,而是「市場還剩下多少能量」 當能量耗盡,崩潰只是時間問題,不是運氣問題 ⚙️ 從假說到代碼:我怎麼把想法變成可計算的東西 假說有了,接下來的問題是:怎麼讓電腦看懂「耗竭」這件事 每個維度都要從一個可以量化的問題出發 🔋 第一個問題:市場「用力」了多少,「推進」了多少? 用力 = 成交量 × 當根K線的高低價差(代表這根K線消耗的總能量) 推進 = 成交量 × 收盤與開盤的實際距離(代表這些能量真正移動了多遠) 兩者都用長週期 RMA 平滑,再取比值。比值越高,代表能量消耗越多、實際推進越少——這就是 EMR 但單純比值沒有意義,要知道「現在的 EMR 在歷史上算高還是低」,所以還要對歷史窗口做正規化,壓縮到 0-100 的尺度。另外,下跌趨勢中的 EMR 訊號意義不同,所以用長期 EMA 判斷趨勢方向,下跌時 EMR 直接歸零,只在上漲趨勢中計算 🌀 第二個問題:價格的「方向感」消失了多少? 我用 Shannon Entropy 來度量這件事。作法是把長週期內的價格範圍切成 N 個等寬區間,然後用指數加權的方式動態更新每個區間被落入的機率。每一根K線進來,就更新一次分布 熵值用這個分布計算出來之後,再除以理論最大熵(所有區間等機率時的熵值),正規化成 0-100。數字越高,代表價格分布越均勻、方向性越弱 ⚡ 第三個問題:兩者「同時加速」怎麼定義? 光看兩個數字高不高還不夠,我需要的是它們同時往上衝的那個時間窗口 作法是分別對 EMR 和熵值算一階差分,再用短週期 EMA 平滑成速度項。兩個速度項同時為正,才算「共振」。共振時,把兩個速度項相乘當作 IBI 脈衝——相乘的好處是只要有一個方向反轉,IBI 就立刻歸零,不會累積假訊號 持續共振達到最低根數門檻才開始累積 IBI 值,中斷後用衰減係數慢慢消退而非硬歸零,模擬能量殘留的物理直覺 🧮 最後:三個維度怎麼合成一個分數? 用加權線性組合打底,再疊加一個三維乘積的非線性交互項 線性部分確保任何一個維度有訊號都能反映;非線性部分確保三者同時高才會讓分數大幅拉升——這對應的假說是「真實的耗竭需要三個維度共振,缺任何一個都只是局部現象」 兩者的比例由 λ 參數控制,可以調整系統對「三維共振」的敏感程度 這就是整個設計邏輯。每一行代碼背後都有一個對應的假說要回答,而不是憑感覺堆疊指標 
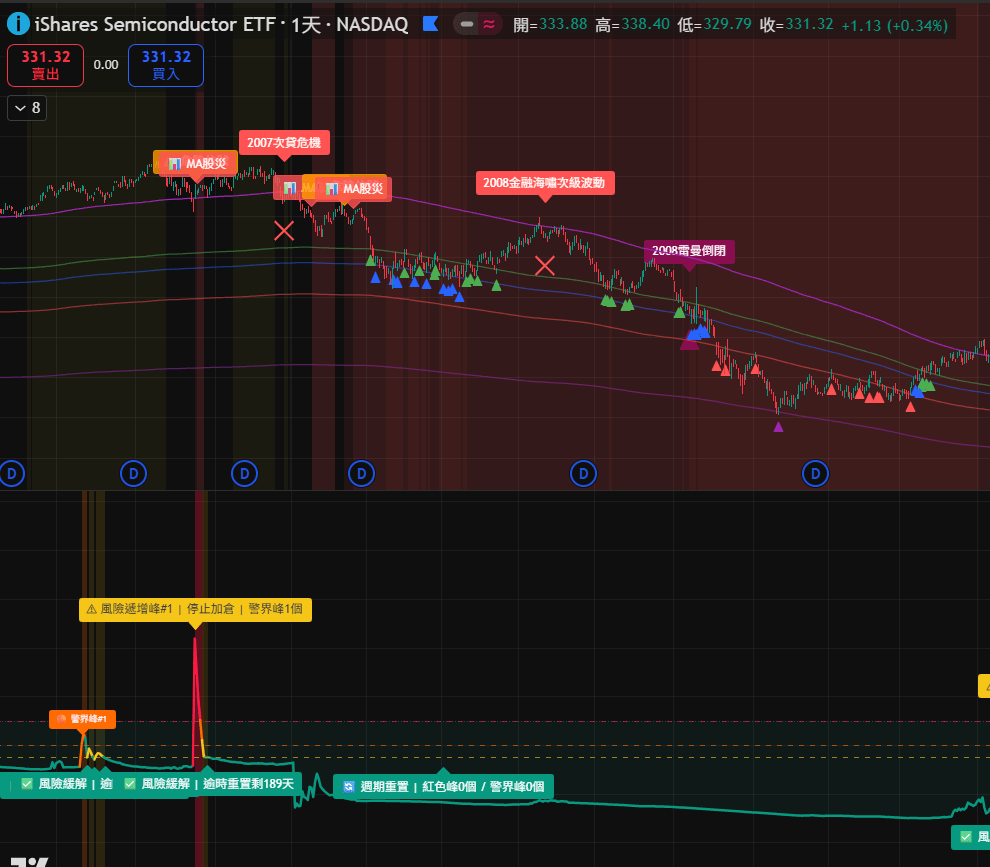
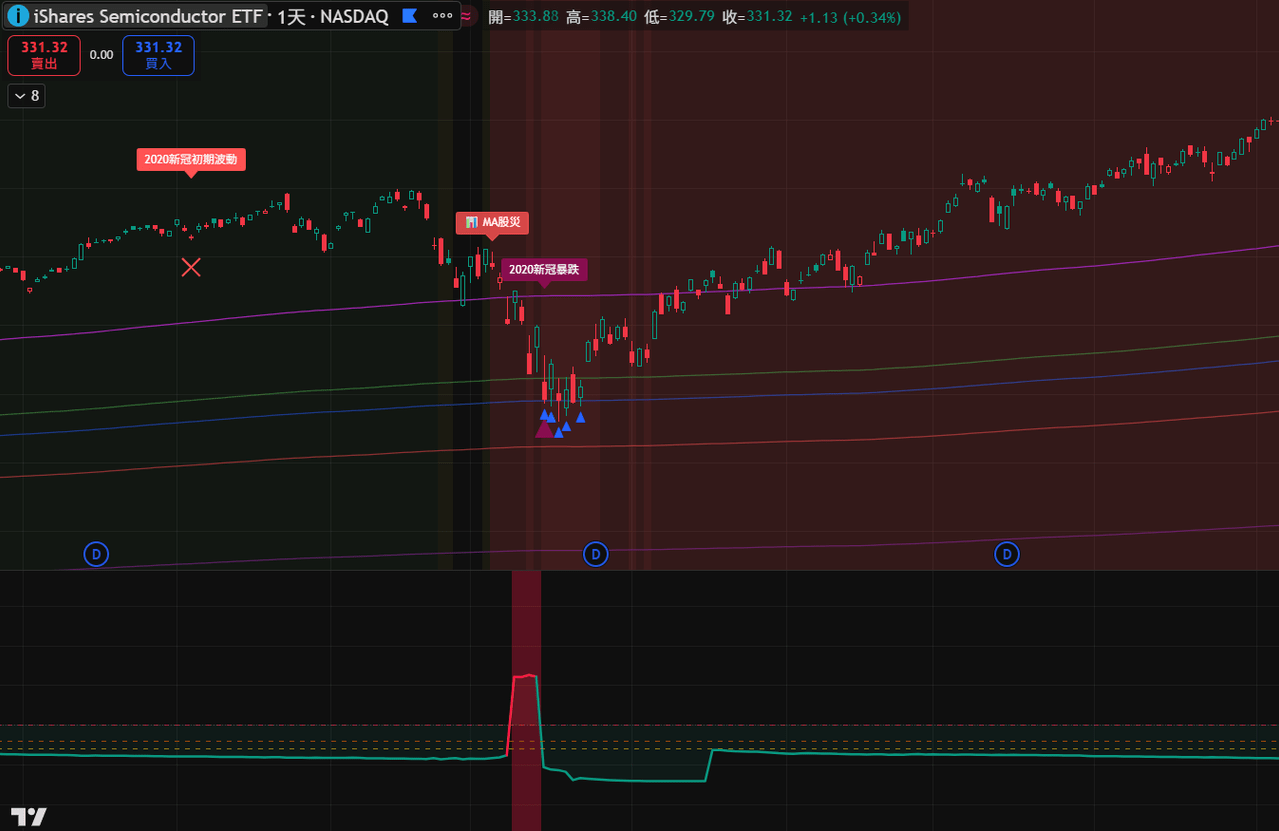
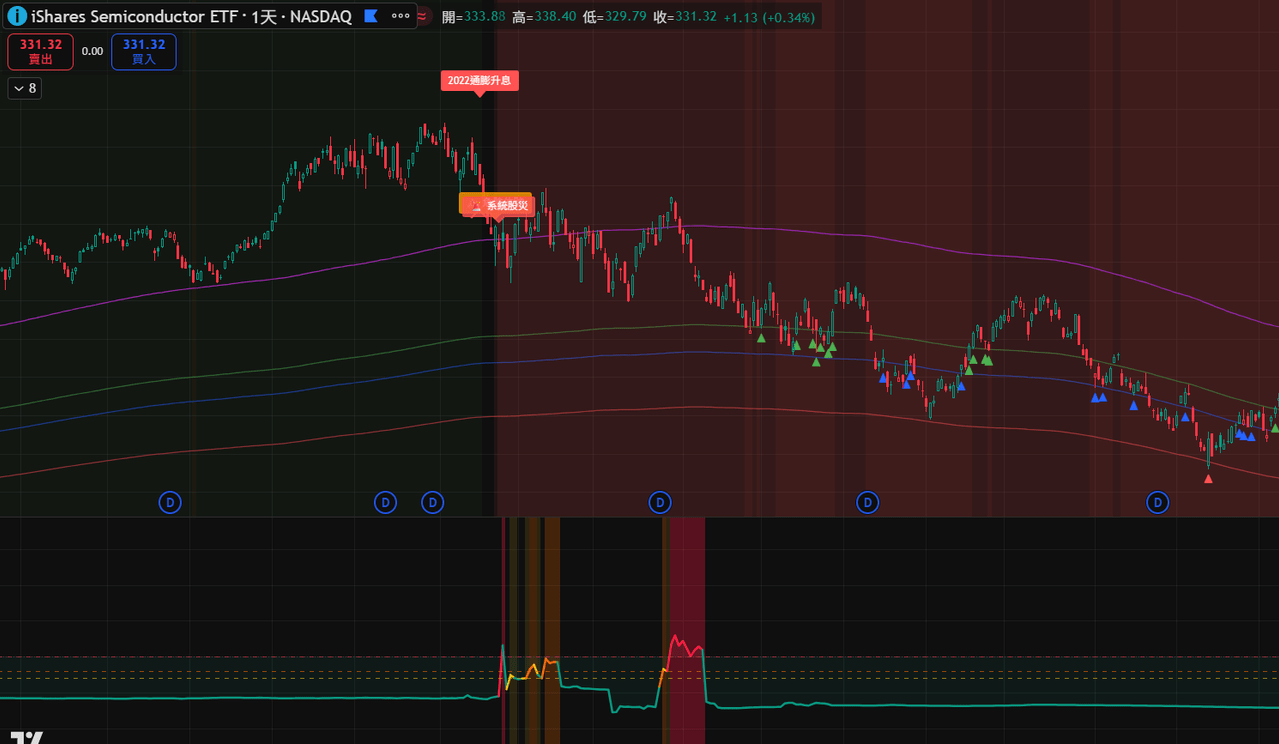
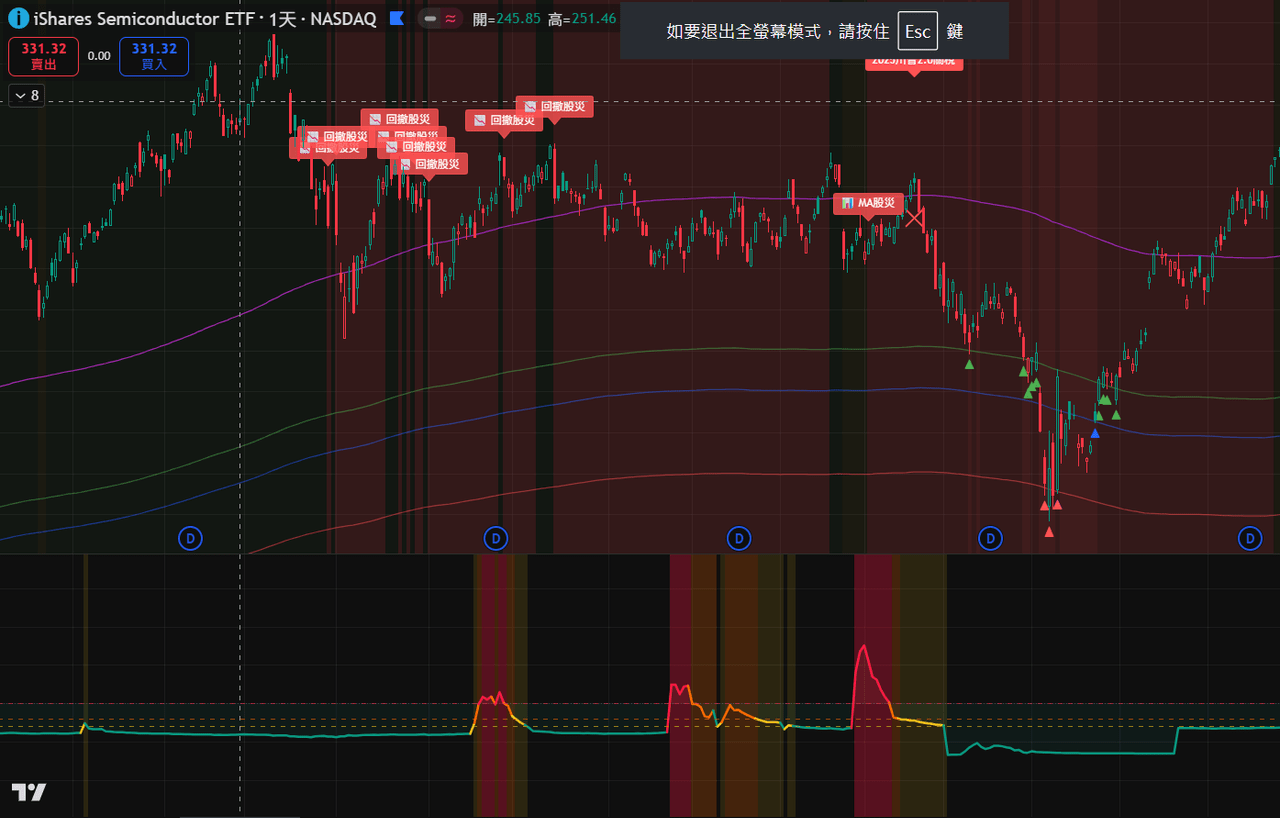
📍 2007-2008 次貸危機 市場在崩潰前出現 1 個紅色耗竭峰,伴隨 1 個橙色警界峰。峰值出現後市場仍撐了相當長的時間才真正崩潰——我定義為「單峰緩頂」結構,火藥裝好了,但板機扣得很慢
megapx
📍 2011 信用評級調降 這次是特殊案例。D-EE 出現了第 4 個紅色耗竭峰,間距長達 299 天,間距極長代表市場能量耗竭的速度非常緩慢,對應的正是一個拖磨型的頂部結構——不是急崩,是慢慢被榨乾的
megapx
📍 2015 中國股災 耗竭峰在崩潰前多次出現,且峰值訊號在主跌段來臨前已經累積了足夠的警告次數。這次的特徵是峰值密集、反覆觸及閾值,市場在高位震盪耗竭的時間拉得很長,直到外部衝擊點火
megapx
📍 2018 貿易戰 D-EE 在年初急跌與年底系統性下跌之前,累積出現多個耗竭峰,且峰值間距呈現收斂趨勢。這次是「長期結構型頂部」的典型——不是一次爆發,而是能量一批一批地被耗掉,直到再也撐不住
megapx
📍 2020 新冠暴跌 這次是 D-EE 最重要的反例之一。暴跌前 D-EE 沒有出現耗竭峰,分數維持在低位。這驗證了核心假說的另一面:真正的外生衝擊,市場來不及耗竭就直接崩了。新冠是板機,但槍膛裡當時沒有足夠的火藥——所以跌得快,也彈得快
megapx
📍 2022 通膨升息 崩潰前出現 2-3 個紅色耗竭峰,且峰值間距急速收斂,壓縮在 50 天以內。間距越來越短,代表市場越來越頻繁地衝擊耗竭臨界,從最後一個峰到真正崩跌只剩不到 33 天
megapx
📍 2025 關稅衝擊 峰值出現後間距迅速收斂,節奏比 2022 更快。D-EE 在主跌前已累積多個耗竭峰,收斂速度之快是近年最極端的案例之一。市場的火藥早就裝好,關稅只是那根火柴
megapx
以下為開源代碼: //@version=6 indicator("D-EE v2.2 [雙層峰值偵測]", "D-EE", overlay=false, max_bars_back=600, max_labels_count=500) //───────────────────────────────────────────────────────────────────────────── // SECTION 1:參數設定 //───────────────────────────────────────────────────────────────────────────── grp1 = "核心參數" grp2 = "熵值設定" grp3 = "IBI 持續性設定" grp4 = "警戒閾值" grp5 = "顯示設定" grp6 = "權重設定" grp7 = "非線性交互設定" grp8 = "峰值偵測設定" lp = input.int(250, "長週期窗口", minval=50, maxval=500, group=grp1) sp = input.int(14, "短週期窗口(IBI)", minval=3, maxval=30, group=grp1) hist_len = input.int(500, "歷史上界估算窗口", minval=200, maxval=1000, group=grp1) src = input.source(close, "來源", group=grp1) n_bins = input.int(8, "價格區間數", minval=4, maxval=16, group=grp2) ibi_min_bars = input.int(3, "IBI 最低持續根數", minval=1, maxval=10, group=grp3) ibi_decay = input.float(0.85,"IBI 中斷衰減係數", minval=0.5, maxval=0.99, step=0.01, group=grp3) lvl_y = input.float(35.0,"🟡 黃色警戒線", step=1.0, group=grp4) lvl_o = input.float(40.0,"🟠 橙色警戒線(警界峰)", step=1.0, group=grp4) lvl_r = input.float(50.0,"🔴 紅色警戒線(風險遞增峰)", step=1.0, group=grp4) show_score = input.bool(true, "顯示 D-EE Score", group=grp5) show_emr = input.bool(false,"顯示 EMR線", group=grp5) show_ent = input.bool(false,"顯示 熵值線", group=grp5) show_ibi = input.bool(false,"顯示 IBI線", group=grp5) show_bg = input.bool(true, "顯示警戒背景", group=grp5) show_lbl = input.bool(true, "顯示事件標籤", group=grp5) show_type = input.bool(true, "顯示股災型態推斷", group=grp5) w_emr = input.float(0.4, "EMR 權重", minval=0.0, maxval=1.0, step=0.05, group=grp6) w_ent = input.float(0.35, "熵值 權重", minval=0.0, maxval=1.0, step=0.05, group=grp6) w_ibi = input.float(0.25, "IBI 權重", minval=0.0, maxval=1.0, step=0.05, group=grp6) lambda = input.float(0.5, "λ 非線性交互強度", minval=0.0, maxval=1.0, step=0.05, group=grp7) interact_exp = input.float(0.7, "交互項冪次", minval=0.3, maxval=1.0, step=0.05, group=grp7) peak_timeout = input.int(200, "峰值逾時重置(日曆天)", minval=50, maxval=500, group=grp8, tooltip="每次新峰值出現後重新計時,超過此天數無新峰值則重置") red_merge_days = input.int(10, "紅色峰合併(日曆天)", minval=3, maxval=30, group=grp8) orange_merge_days = input.int(20, "橙色峰合併(日曆天)", minval=5, maxval=60, group=grp8) interval_fast = input.int(50, "快速收斂閾值(日曆天)", minval=20, maxval=100, group=grp8) interval_mid = input.int(100, "中速收斂閾值(日曆天)", minval=50, maxval=200, group=grp8) // 毫秒轉日曆天 ms_per_day = 86400000 //───────────────────────────────────────────────────────────────────────────── // SECTION 2:工具函數 //───────────────────────────────────────────────────────────────────────────── abs_norm100(x, lo_abs, hi_window) => hi = ta.highest(x, hi_window) rng = hi - lo_abs rng > 0.0 ? math.min((x - lo_abs) / rng * 100.0, 100.0) : 50.0 //───────────────────────────────────────────────────────────────────────────── // SECTION 3:EMR 努力動量比 //───────────────────────────────────────────────────────────────────────────── effort_raw = volume * (high - low) momentum_raw = volume * math.abs(close - open) effort_ma = ta.rma(effort_raw, lp) momentum_ma = ta.rma(momentum_raw, lp) emr_raw = momentum_ma > 0.0 ? effort_ma / momentum_ma : 1.0 emr_norm_abs = abs_norm100(emr_raw, 1.0, hist_len) ema_lp = ta.ema(src, lp) trend_up = ema_lp > ema_lp[10] emr_norm = trend_up ? emr_norm_abs : 0.0 //───────────────────────────────────────────────────────────────────────────── // SECTION 4:Shannon Entropy //───────────────────────────────────────────────────────────────────────────── p_hi = ta.highest(src, lp) p_lo = ta.lowest(src, lp) p_rng = p_hi - p_lo p_rel = p_rng > 0.0 ? (src - p_lo) / p_rng : 0.5 var float[] bin_prob = array.new_float(16, 1.0 / 8) bin_size = 1.0 / n_bins cur_bin = math.min(int(p_rel / bin_size), n_bins - 1) alpha_ent = 2.0 / (lp + 1.0) for i = 0 to n_bins - 1 hit = cur_bin == i ? 1.0 : 0.0 prev_p = array.get(bin_prob, i) array.set(bin_prob, i, prev_p + alpha_ent * (hit - prev_p)) entropy_raw = 0.0 for i = 0 to n_bins - 1 p_i = array.get(bin_prob, i) if p_i > 0.001 entropy_raw -= p_i * math.log(p_i) / math.log(2.0) max_entropy = math.log(float(n_bins)) / math.log(2.0) entropy_norm = max_entropy > 0.0 ? (entropy_raw / max_entropy) * 100.0 : 0.0 //───────────────────────────────────────────────────────────────────────────── // SECTION 5:IBI 慣性破壞係數 //───────────────────────────────────────────────────────────────────────────── emr_vel = ta.ema(emr_norm_abs - emr_norm_abs[1], sp) ent_vel = ta.ema(entropy_norm - entropy_norm[1], sp) both_rising = emr_vel > 0.0 and ent_vel > 0.0 ibi_pulse = both_rising ? emr_vel * ent_vel : 0.0 var int ibi_count = 0 var float ibi_val = 0.0 ibi_count := both_rising ? ibi_count + 1 : 0 if ibi_count >= ibi_min_bars ibi_val := ibi_pulse else if not both_rising ibi_val := ibi_val * ibi_decay ibi_hi = ta.highest(ibi_val, hist_len) ibi_norm = ibi_hi > 0.0 ? math.min(ibi_val / ibi_hi * 100.0, 100.0) : 0.0 //───────────────────────────────────────────────────────────────────────────── // SECTION 6:D-EE Score 合成 //───────────────────────────────────────────────────────────────────────────── w_sum = w_emr + w_ent + w_ibi linear_score = (emr_norm * w_emr + entropy_norm * w_ent + ibi_norm * w_ibi) / w_sum interaction = math.pow(emr_norm / 100.0, interact_exp) * math.pow(entropy_norm / 100.0, interact_exp) * math.pow(ibi_norm / 100.0, interact_exp) * 100.0 ee_score = (1.0 - lambda) * linear_score + lambda * interaction //───────────────────────────────────────────────────────────────────────────── // SECTION 7:警戒狀態 //───────────────────────────────────────────────────────────────────────────── at_yellow = ee_score >= lvl_y at_orange = ee_score >= lvl_o at_red = ee_score >= lvl_r bg_col = show_bg ? (at_red ? color.new(#ff1744, 70) : at_orange ? color.new(#ff6b00, 78) : at_yellow ? color.new(#f5c518, 88) : na) : na bgcolor(bg_col) //───────────────────────────────────────────────────────────────────────────── // SECTION 8:雙層峰值偵測系統(日曆天版本) //───────────────────────────────────────────────────────────────────────────── var int r_peak_count = 0 var int r_peak_interval = 0 // 日曆天 var int r_peak_interval_prev = 0 // 日曆天 var float r_peak_score_max = 0.0 var bool r_in_peak = false var int o_peak_count = 0 var float o_peak_score_max = 0.0 var bool o_in_peak = false // 用 time(毫秒時間戳)記錄峰值發生時間,換算成日曆天 var int r_peak_time_last = 0 // 上一個紅色峰的 time(ms) var int o_peak_time_last = 0 // 上一個橙色峰的 time(ms) var int first_peak_time = 0 // 本週期第一個峰的 time(ms) // 黑天鵝判斷旗標:只有從未有過任何峰值(全新週期)才可能是黑天鵝 // 重置後 is_fresh_cycle = true,出現第2個峰後永遠是 false var bool is_fresh_cycle = true entered_red = at_red and not at_red[1] exited_red = not at_red and at_red[1] entered_orange = at_orange and not at_orange[1] and not at_red exited_orange = not at_orange and at_orange[1] and not at_red // 當前 time 轉換為日曆天的輔助計算 cur_time = time // 逾時計算(日曆天):從最後一個峰起算 last_any_peak_time = r_peak_time_last > o_peak_time_last ? r_peak_time_last : o_peak_time_last any_peak_count = r_peak_count + o_peak_count days_since_last_any = any_peak_count > 0 ? int((cur_time - last_any_peak_time) / ms_per_day) : 0 days_since_first = any_peak_count > 0 ? int((cur_time - first_peak_time) / ms_per_day) : 0 do_reset = any_peak_count > 0 and days_since_last_any >= peak_timeout and not at_orange if do_reset r_peak_count := 0 r_peak_interval := 0 r_peak_interval_prev := 0 r_peak_score_max := 0.0 r_in_peak := false o_peak_count := 0 o_peak_score_max := 0.0 o_in_peak := false r_peak_time_last := 0 o_peak_time_last := 0 first_peak_time := 0 // ── 紅色風險遞增峰 ── days_since_last_red = r_peak_count > 0 ? int((cur_time - r_peak_time_last) / ms_per_day) : 999 is_new_red = entered_red and not do_reset and (r_peak_count == 0 or days_since_last_red > red_merge_days) is_same_red = entered_red and not do_reset and r_peak_count > 0 and days_since_last_red <= red_merge_days if is_new_red r_peak_interval_prev := r_peak_count > 0 ? r_peak_interval : 0 r_peak_interval := r_peak_count > 0 ? int((cur_time - r_peak_time_last) / ms_per_day) : 0 r_peak_count := r_peak_count + 1 r_peak_time_last := cur_time r_peak_score_max := ee_score r_in_peak := true if first_peak_time == 0 first_peak_time := cur_time if is_same_red r_peak_time_last := cur_time r_peak_score_max := math.max(r_peak_score_max, ee_score) r_in_peak := true if r_in_peak and at_red and not entered_red r_peak_score_max := math.max(r_peak_score_max, ee_score) if exited_red r_in_peak := false // ── 橙色警界峰(未達紅色才計)── days_since_last_orange = o_peak_count > 0 ? int((cur_time - o_peak_time_last) / ms_per_day) : 999 is_new_orange = entered_orange and not do_reset and (o_peak_count == 0 or days_since_last_orange > orange_merge_days) is_same_orange = entered_orange and not do_reset and o_peak_count > 0 and days_since_last_orange <= orange_merge_days if is_new_orange o_peak_count := o_peak_count + 1 o_peak_time_last := cur_time o_peak_score_max := ee_score o_in_peak := true if first_peak_time == 0 first_peak_time := cur_time if is_same_orange o_peak_time_last := cur_time o_peak_score_max := math.max(o_peak_score_max, ee_score) o_in_peak := true if o_in_peak and at_orange and not at_red and not entered_orange o_peak_score_max := math.max(o_peak_score_max, ee_score) if exited_orange o_in_peak := false // 紅色峰收斂判斷 r_converging = r_peak_count >= 3 and r_peak_interval_prev > 0 and r_peak_interval < r_peak_interval_prev // 減倉建議 reduce_pct = r_peak_count <= 1 ? 0 : r_peak_count == 2 and r_peak_interval > interval_mid ? 10 : r_peak_count == 2 and r_peak_interval > interval_fast ? 20 : r_peak_count == 2 ? 30 : r_peak_count == 3 and r_converging ? 40 : r_peak_count == 3 ? 30 : r_converging ? math.min(10 * r_peak_count, 70) : math.min(10 * (r_peak_count - 1), 60) //───────────────────────────────────────────────────────────────────────────── // SECTION 9:股災型態推斷 // 黑天鵝條件:必須是 is_fresh_cycle(全新週期,從未累積過多個峰值) // 不再用 days_since_first,避免重置後誤判 //───────────────────────────────────────────────────────────────────────────── // 重置後的當根 any_peak_count 已歸零,用實際歸零後的值來判斷型態 effective_peak_count = do_reset ? 0 : any_peak_count effective_r_count = do_reset ? 0 : r_peak_count effective_o_count = do_reset ? 0 : o_peak_count // 型態比對邏輯(根據 SOXX 2004-2025 實測數據) // 優先順序:峰值數 → 間距 → 收斂速度 → 警界峰數量 // 計算平均間距(只有2個以上紅色峰才有意義) avg_interval = r_peak_count >= 2 ? (r_peak_interval + r_peak_interval_prev) / 2 : 0 crash_type = effective_peak_count == 0 ? "✅ 等待訊號" : // 單紅色峰 + 大量警界峰 → 2004政策驅動超早型 effective_r_count == 1 and effective_o_count >= 3 ? "🕐 類2004 政策驅動超早型 | 預警可能300+天 | 從容分批減倉" : // 單紅色峰 + 少量警界峰 → 觀察中,可能是2011或2020 effective_r_count == 1 and effective_o_count <= 1 ? "🔍 類2011/2020 觀察中 | 單峰無法判斷 | 等第2峰確認" : // 單紅色峰 + 中等警界峰 effective_r_count == 1 ? "🔍 觀察中(第1風險遞增峰) | 等第2峰判斷間距" : // 雙紅色峰 + 間距收斂快(<50天)→ 類2022 effective_r_count == 2 and r_peak_interval < interval_fast ? "⚠ 類2022 中等累積加速型 | 間距急縮 | 最後峰後約33天 | 立即減倉30%" : // 雙紅色峰 + 間距中等(50-100天)→ 類2008 effective_r_count == 2 and r_peak_interval >= interval_fast and r_peak_interval < interval_mid ? "📊 類2008 中等累積型 | 間距中等 | 最後峰後約144天 | 減倉20%" : // 雙紅色峰 + 間距較長(>100天)→ 類2008緩慢版 effective_r_count == 2 ? "📊 類2008 中等累積型(緩) | 間距寬鬆 | 減倉10%" : // 三紅色峰 + 收斂中 → 類2025 effective_r_count == 3 and r_converging ? "⚠ 類2025 中等累積加速型 | 間距收斂中 | 最後峰後約35天 | 減倉40%" : // 三紅色峰 + 未收斂 → 類2022擴展版 effective_r_count == 3 and not r_converging ? "📊 類2022擴展 中等累積型 | 間距持平 | 減倉30%" : // 四紅色峰 + 收斂 → 類2018 effective_r_count == 4 and r_converging ? "🏗 類2018 長期結構型(收斂) | 間距加速縮短 | 最後峰後約90天 | 減倉50%" : // 四紅色峰 + 未收斂 → 類2018早期 effective_r_count == 4 ? "🏗 類2018 長期結構型 | 間距尚未收斂 | 減倉40%" : // 五紅色峰以上 + 大量警界峰 → 類2015 effective_r_count >= 5 and effective_o_count >= 3 ? "🏗 類2015 長期結構型 | 出場機會最多 | 最後峰後約44天 | 減倉60%" : // 五紅色峰以上 effective_r_count >= 5 ? "🏗 類2015/2018 長期結構型 | 多峰累積 | 減倉60%" : // 只有橙色峰 effective_r_count == 0 and effective_o_count >= 2 ? "👁 早期預警累積中 | 等待紅色風險遞增峰" : effective_r_count == 0 and effective_o_count == 1 ? "👁 早期預警初現 | 單一警界峰,持續觀察" : "🔍 持續觀察中" //───────────────────────────────────────────────────────────────────────────── // SECTION 10:繪圖 //───────────────────────────────────────────────────────────────────────────── plot(show_emr ? emr_norm : na, "EMR", color.new(#ff9800, 20), 1) plot(show_ent ? entropy_norm : na, "熵值", color.new(#2196f3, 20), 1) plot(show_ibi ? ibi_norm : na, "IBI", color.new(#e040fb, 30), 1) ee_col = at_red ? #ff1744 : at_orange ? #ff6b00 : at_yellow ? #f5c518 : #089981 p_ee = plot(show_score ? ee_score : na, "D-EE Score", ee_col, 2) p_mid = plot(50, color=na, editable=false) fill(p_ee, p_mid, ee_score > 50.0 ? color.new(#ff5252, 92) : color.new(#089981, 92)) hline(lvl_r, "🔴 風險遞增峰線", color.new(#ff1744, 40), linestyle=hline.style_dashed) hline(lvl_o, "🟠 警界峰線", color.new(#ff6b00, 40), linestyle=hline.style_dashed) hline(lvl_y, "🟡 黃色警戒", color.new(#f5c518, 40), linestyle=hline.style_dashed) hline(50, "中線", color.new(color.gray, 60), linestyle=hline.style_dotted) //───────────────────────────────────────────────────────────────────────────── // SECTION 11:事件標籤 //───────────────────────────────────────────────────────────────────────────── if barstate.isconfirmed if show_lbl and is_new_orange label.new(bar_index, ee_score + 4, "🟠 警界峰#" + str.tostring(o_peak_count), style=label.style_label_down, color=#ff6b00, textcolor=color.white, size=size.tiny) if show_lbl and is_new_red and r_peak_count == 1 label.new(bar_index, ee_score + 4, "⚠ 風險遞增峰#1 | 停止加倉 | 警界峰" + str.tostring(o_peak_count) + "個", style=label.style_label_down, color=#f5c518, textcolor=color.black, size=size.small) if show_lbl and is_new_red and r_peak_count >= 2 lbl_col = r_peak_interval < interval_fast ? #ff1744 : r_peak_interval < interval_mid ? #ff6b00 : #f5c518 label.new(bar_index, ee_score + 4, "🔴 風險遞增峰#" + str.tostring(r_peak_count) + " | 間距:" + str.tostring(r_peak_interval) + "天 " + (r_converging ? "↓收斂" : "→持平") + " | 減倉" + str.tostring(reduce_pct) + "%", style=label.style_label_down, color=lbl_col, textcolor=color.white, size=size.small) if show_lbl and do_reset label.new(bar_index, lvl_y - 4, "🔄 週期重置 | 紅色峰" + str.tostring(r_peak_count) + "個 / 警界峰" + str.tostring(o_peak_count) + "個", style=label.style_label_up, color=#089981, textcolor=color.white, size=size.small) if show_lbl and ta.crossunder(ee_score, lvl_y) and any_peak_count > 0 and not do_reset label.new(bar_index, ee_score - 3, "✅ 風險緩解 | 逾時重置剩" + str.tostring(peak_timeout - days_since_last_any) + "天", style=label.style_label_up, color=#089981, textcolor=color.white, size=size.small) //───────────────────────────────────────────────────────────────────────────── // SECTION 12:資訊面板 //───────────────────────────────────────────────────────────────────────────── var table info = table.new(position.top_right, 2, 10, border_width=1, bgcolor=color.new(color.black, 20)) if barstate.islast int_col = r_peak_count < 2 ? color.gray : r_peak_interval < interval_fast ? color.red : r_peak_interval < interval_mid ? color.orange : color.yellow conv_str = r_peak_count < 3 ? "─" : r_converging ? "↓ 收斂中" : "→ 持平" conv_col = r_converging ? color.red : color.gray red_col = reduce_pct >= 50 ? color.red : reduce_pct >= 30 ? color.orange : reduce_pct >= 10 ? color.yellow : color.green days_left = peak_timeout - days_since_last_any table.cell(info, 0, 0, "D-EE 雙層峰值系統", bgcolor=color.new(#ff1744,40), text_color=color.white, text_size=size.normal) table.cell(info, 1, 0, "v2.2", bgcolor=color.new(#ff1744,40), text_color=color.white) table.cell(info, 0, 1, "D-EE Score", text_color=color.gray) table.cell(info, 1, 1, str.tostring(ee_score, "#.##"), text_color=ee_col) table.cell(info, 0, 2, "🔴 風險遞增峰", text_color=color.gray) table.cell(info, 1, 2, r_peak_count > 0 ? "第" + str.tostring(r_peak_count) + "峰" : "未出現", text_color=r_peak_count > 0 ? color.red : color.green) table.cell(info, 0, 3, "🟠 警界峰", text_color=color.gray) table.cell(info, 1, 3, o_peak_count > 0 ? "共" + str.tostring(o_peak_count) + "峰" : "未出現", text_color=o_peak_count > 0 ? color.orange : color.green) table.cell(info, 0, 4, "風險遞增峰間距", text_color=color.gray) table.cell(info, 1, 4, r_peak_count >= 2 ? str.tostring(r_peak_interval) + " 天" : "─", text_color=int_col) table.cell(info, 0, 5, "收斂狀態", text_color=color.gray) table.cell(info, 1, 5, conv_str, text_color=conv_col) table.cell(info, 0, 6, "逾時倒數", text_color=color.gray) table.cell(info, 1, 6, any_peak_count > 0 ? str.tostring(days_left) + " 天" : "─", text_color=days_left < peak_timeout * 0.3 ? color.orange : color.gray) table.cell(info, 0, 7, "建議減倉", text_color=color.gray) table.cell(info, 1, 7, any_peak_count > 0 ? str.tostring(reduce_pct) + "%" : "持倉", text_color=red_col) table.cell(info, 0, 8, "━━━━━━━", text_color=color.new(color.gray,60), text_size=size.small) table.merge_cells(info, 0, 8, 1, 8) type_col = crash_type == "✅ 無風險信號" ? color.green : str.contains(crash_type, "黑天鵝") ? color.red : str.contains(crash_type, "加速") ? color.red : str.contains(crash_type, "長期") ? color.orange : color.yellow table.cell(info, 0, 9, "推斷型態", text_color=color.gray) table.cell(info, 1, 9, show_type ? crash_type : "已隱藏", text_color=type_col, text_size=size.small) //───────────────────────────────────────────────────────────────────────────── // SECTION 13:Alert 條件 //───────────────────────────────────────────────────────────────────────────── alertcondition(is_new_orange, "[D-EE] 🟠 警界峰出現", "橙色警界峰觸發,開始監控風險遞增峰") alertcondition(is_new_red and r_peak_count == 1, "[D-EE] ⚠ 風險遞增峰#1:停止加倉", "紅色風險遞增峰首次出現") alertcondition(is_new_red and r_peak_count == 2, "[D-EE] 🔴 風險遞增峰#2:開始減倉", "第2風險遞增峰,建議減倉10-30%") alertcondition(is_new_red and r_peak_count == 3, "[D-EE] 🔴 風險遞增峰#3:加速減倉", "第3風險遞增峰,間距收斂中") alertcondition(is_new_red and r_peak_count >= 4, "[D-EE] 🚨 風險遞增峰#4+:防禦倉位","累積4個以上風險遞增峰") alertcondition(do_reset, "[D-EE] 🔄 週期重置", "逾時無新峰值,計數器歸零")
此指標已經整合進LEI指標裡,作為S6維度的判斷
有興趣指標或交流的,歡迎嘉我的DC
愛心
35
2
全部留言